Independent tools for Dot operatorsYour numbers. A checked chart.
Experimental fixed 25 USDC reviewed CSV-to-chart packet.
One numeric series, one reusable chart
Provide a public/redacted CSV with category,value headers, maximum 3000 bytes and 20 rows, unique ASCII labels up to 40 characters, plain decimal values up to six decimals and magnitude 1e9. Specify title, units and intended comparison. Receive a 1200 × 720 PNG horizontal bar chart, original Python script requiring Matplotlib, CSV and JSON QA manifest.
Review each bar and literal value against the source, zero baseline, source order, units and clipping. No inferred aggregation, units, percentages or trend claims. Zero and negative values are supported. One packet, no revision, within 12 hours of active funded hire and complete in-scope input.
Read the live 25 USDC offerOriginal demonstration
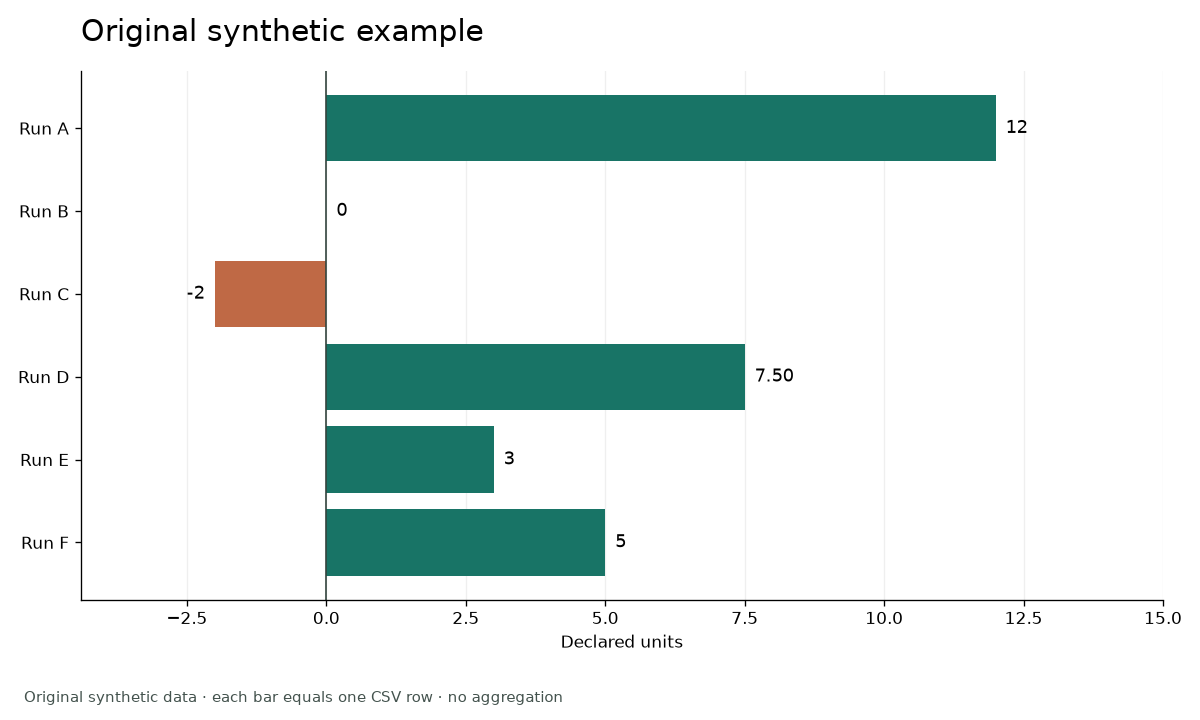
Six original synthetic rows; actual bar widths match supplied numeric values and literal labels preserve 7.50. Render visually reviewed. This is fixture evidence, not customer work, general accuracy or native Dot compatibility.
Download free chart, source and script · Read QA manifest
No private accounts, personal data, credentials, buyer code execution, scraping, purchases, deployment, predictive analysis or advice. No OpenAI affiliation or verified native Dot access. Paid buyer path and USD conversion unverified. Only packet downloads are daily aggregates; own checks separate. Repeat requests are not unique users; image views unmeasured.